MRI Viewer and Editor
Overview
MRI Viewer is a web-based viewer for DICOM and other formats. It creates a 3D model of a body part based on a set of plane images (DICOM, NIfTI, HDR, KTX, etc. file formats) and shows 2D/3D views via a web browser without any installations. MRI Viewer will please you with speed and convenience in comparison even with desktop analogues. Fast smooth 3D visualization is based on unique rendering algorithms developed at EPAM. These algorithms do not require data preprocessing, thus visualization starts right after data loading.
MRI Viewer can edit volumetric data in order to select areas of interest. This functionality is implemented with automatic and semi-automatic segmentation methods.
The viewer is a free and open-source software. Try MRI Viewer demo online — epa.ms/mri.
We did not find a similar web-tool. We have developed a unique optimization of isosurface rendering algorithm.
Key Features
DICOM, NIfTI, KTX, and HDR formats support.
Five view modes, 3D and 2D visualization.
Real-time adjustment of isosurface and transfer function levels in 3D views.
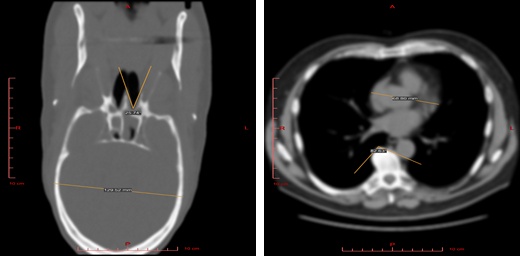
Measurement of distances, angles, and areas in 2D views.
Viewing sample in any standard projection.
DICOM tags displaying.
Real-time volume clipping to open areas of interest.
Automatic volume segmentation.
Semi-automatic methods for areas of interest opening/selection.
Segmentation data visualization.
JavaScript + WebGL.
Fast and Comfortable
Simple user interface without rarely-used functions.
Combined surface and volume visualization mode.
Support for diverse data sources: a local computer, CD/DVD, a server, or a cloud.
No installation on a user computer required.
Compatibility with all popular desktop OSs.
Simple User Interface
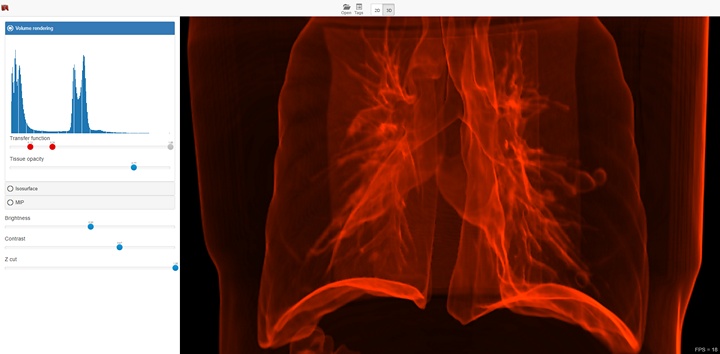
The functionality depends on the selected visualization mode (2D or 3D), and in case of 3D mode on the selected visualization method. The screenshot below shows a 3D visualization mode with a volume render method. In this case, the interface provides the ability to select areas of interest inside the volume, brightness and contrast adjustment, as well as the ability to use the near clipping plane position.
3D Visualization
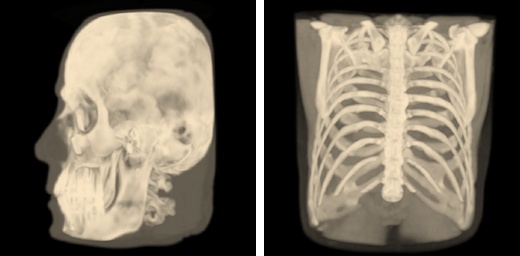
Isosurface Visualization
This method suits for bones, skin surface and segmented areas visualization. The base of this method is a search of intersection points between the rays corresponding to pixels and the isosurface. The user selects the level of the isosurface and the clipping plane position with sliders.

Volume Visualization
This method suits for studying the initial data volume and the soft tissues visualization. It allows to choose an area of the interest by specifying the transfer function, which assigns the amount of the initial data to the amount of the transparency and color. To simplify the transfer function, the user uses a function in the application. The user can define this function by adjusting three parameters (a, b, and c) with sliders. The function is nonzero only if the intensity i satisfies the conditions a < i < b or i > c. When the function satisfies the first condition, the user can determine the transparency value by the value of the additional slider, and when it satisfies the second one, the transparency value is considered equal to 1. Such a subset of transfer functions is sufficient to visualize the overwhelming array of medical data. The base of this method is the calculation of the volume integral along the rays passing through the pixels.

Max Intensity Projection (MIP)
The method suits for the primary analysis of the initial data, as it does not require setting values of any parameters. This method is based on computation of the maximum values for intensities of the original data along the rays passing through the pixels.
Segmented Data Visualization
User can select ROI (Region of Interest) during segmented data visualization.

2D Visualization
Use this mode to view raw data sections in different projections and to measure the linear and angular dimensions of fragments of this data.
DICOM Tags
DICOM Tags contain information about the source data such as patient data, date of data production, distance between images, and so on.

Edit/Advanced View functionality
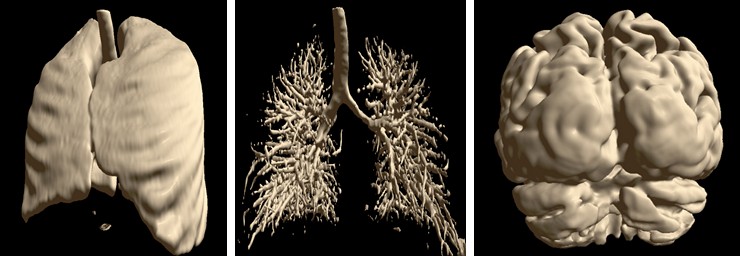
Automatic Segmentation
Special automatic segmentation methods are implemented for the lungs data and skull tissues separation from brain.
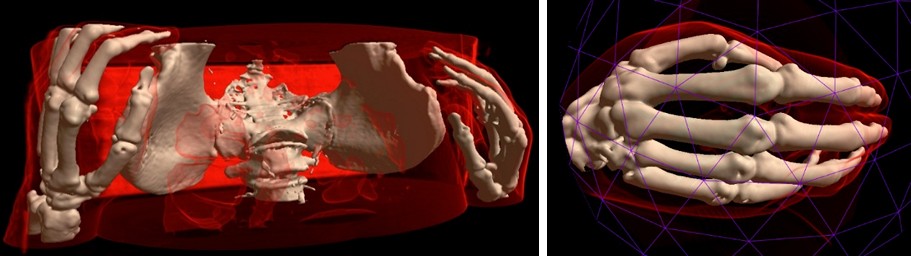
Semi-automatic Methods for Opening Areas of Interest
MRI Viewer has two methods for opening/selection areas of interest. The first one allows to clear volumetric data, which obstructs area of interest.

The second method allows to cut the area of interest from the source volume using deformable 3D triangle mesh.
Try in One Click
You can try the MRI Viewer demo online. Please note that not all browsers and video cards are supported yet.
The product is under development. More features are planned for future releases: automated segmentation, volume cut, automated ROI detection, complex colored transfer functions, etc.
Source Code
MRI Viewer is under active development and its source code is available at GitHub.
License
Licensed under the Apache License, Version 2.0 (the “License”); you may not use this file except in compliance with the License. You may obtain a copy of the License at
Unless required by applicable law or agreed to in writing, software distributed under the License is distributed on an “AS IS” BASIS, WITHOUT WARRANTIES OR CONDITIONS OF ANY KIND, either express or implied. See the License for the specific language governing permissions and limitations under the License.
Feedback
Do you need assistance with our tools? Do you need a feature? Do you want to send a patch to us? Did you find a bug? Report issues at GitHub or contact us directly at mri@epam.com